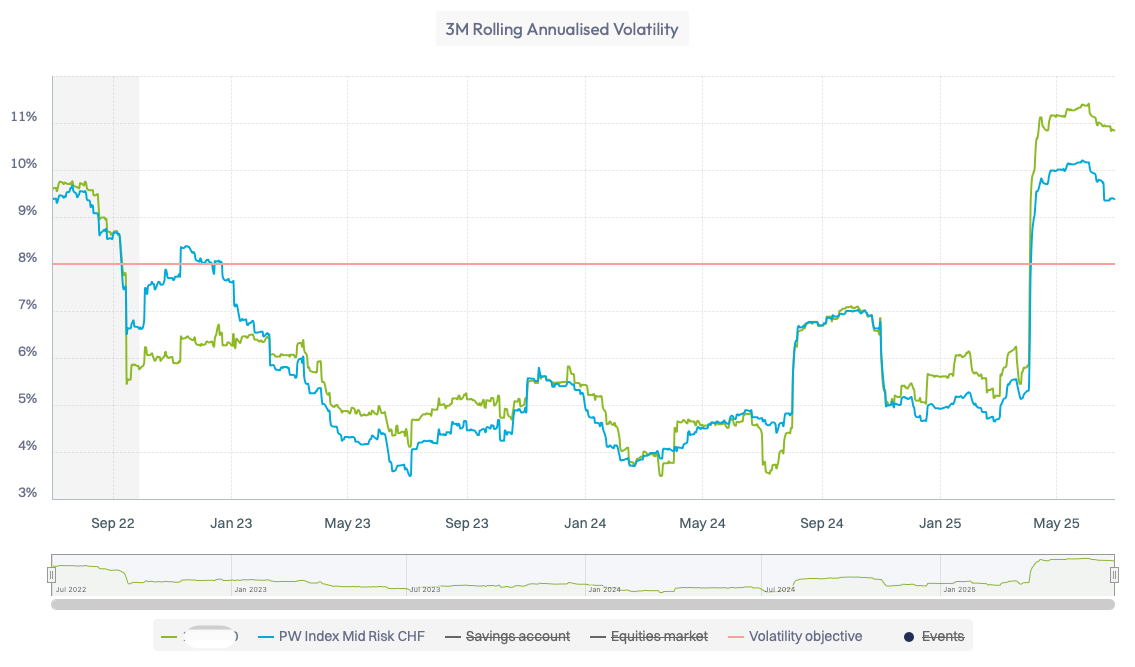

3M Rolling Annualised Volatility
This chart displays the three-month moving average of the annualised daily volatility of the selected instrument, as well as that of its benchmark index (if applicable), over a specified period.
Time series can be selected and deselected in the legend.
