
3M Rolling Return
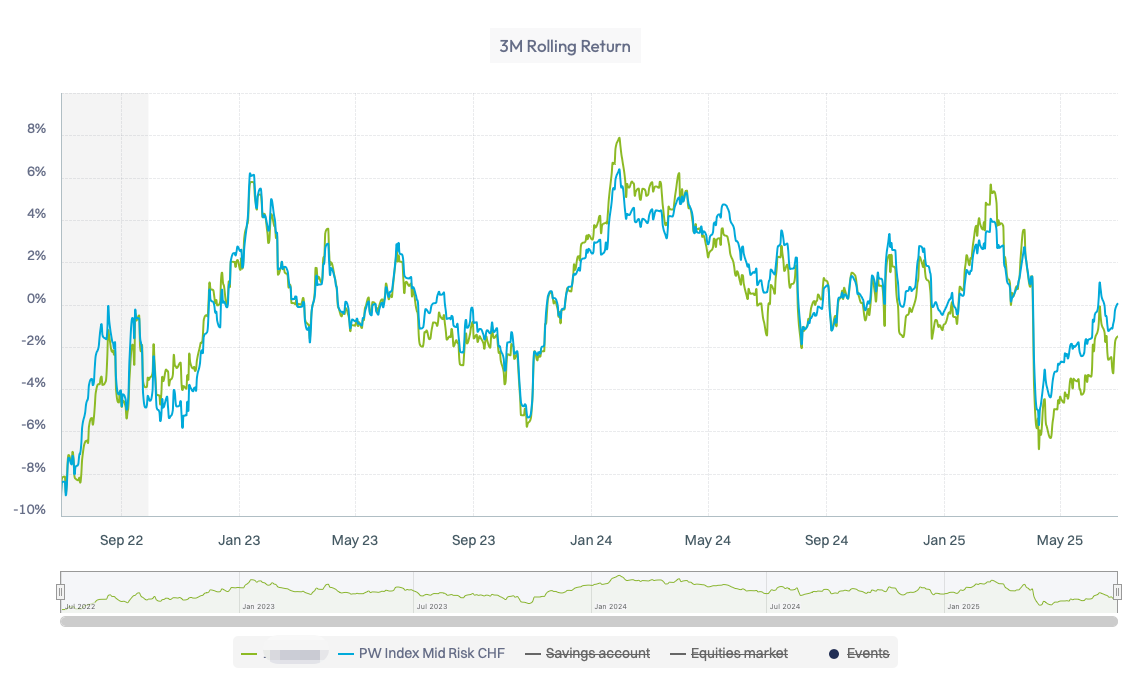
This chart displays the rolling daily performance over three months for the selected instrument, along with its benchmark if available, during a specified period.
Time series can be selected and deselected in the legend.


This chart displays the rolling daily performance over three months for the selected instrument, along with its benchmark if available, during a specified period.
Time series can be selected and deselected in the legend.