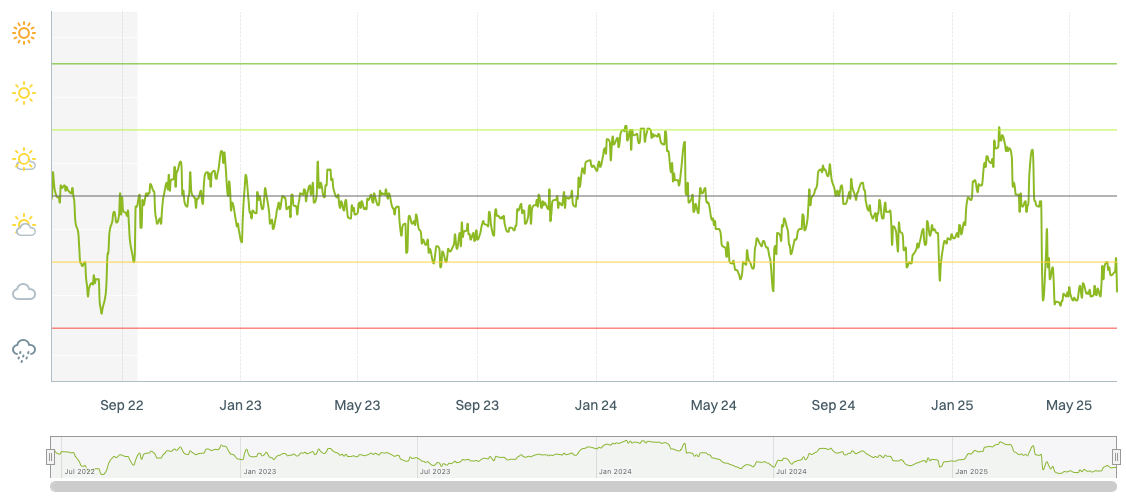

3M Rolling Weather
Graph showing the 3-month moving average of the Perfometer.
The scale on the left shows the weather zones reached by the Perfometer each day.


Graph showing the 3-month moving average of the Perfometer.
The scale on the left shows the weather zones reached by the Perfometer each day.