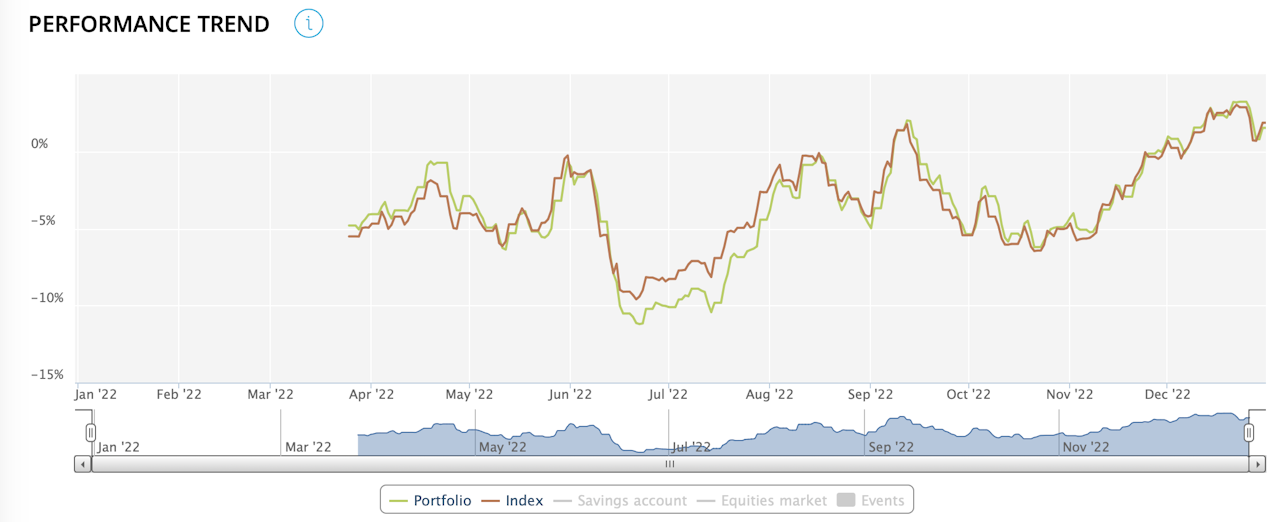

Performance Trend
For a portfolio and its benchmark index, this graph shows the daily rolling performance over 3 months for a given period.
By selecting 'Savings Account' and 'World Equities' in the legend, the cumulative risk of these is displayed. This makes it possible to limit the universe of possibilities for a multi-asset portfolio.
