
Relative Weather
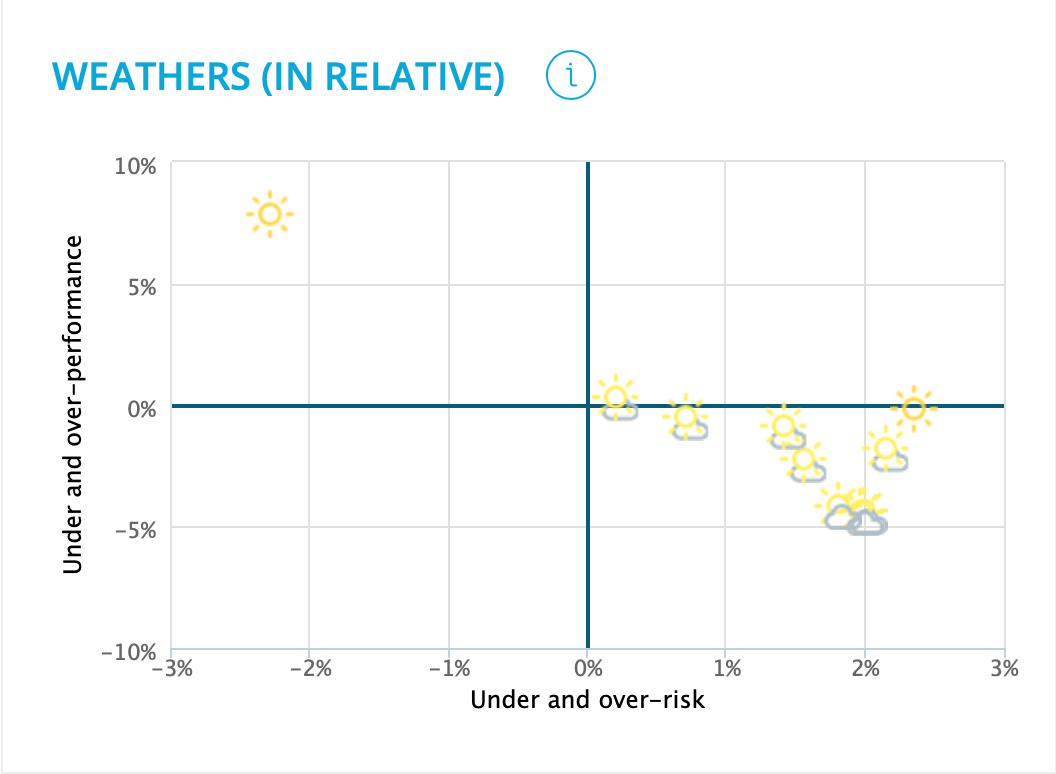
This graph shows the portfolios in the selected filter in relation to their PW benchmark index within a risk/return framework.
The PW benchmark is determined by the risk level chosen and the currency of each portfolio.
Each portfolio is illustrated by a symbol representing the size of the risk-adjusted outperformance/underperformance, ranging from 'sunny' to 'stormy'.
The graph's axes represent the benchmark index values for the portfolio concerned. Any value below the horizontal axis or to the left of the vertical axis is below that of the index (and vice versa).
